HSI - not time yet - from our weekend notes

Recent upgrades include DANG for ~8%, HOLI for ~11% in two
weeks.
Tech
Rating:
-2
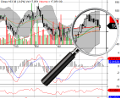
This
is a case of trend follower beware. We see price and the GURU moving averages
stacked up in order vertically above price in what looks a fresh trend.
However, all other signals are weighing in with regression analysis throwing
strength in for negative price movement. GURU MACD and GURU Stochastics are
trading below signal line and in the wrong side of an arc with a negative slope
on our settings. The GURU CCI is neutral as is RSI – there wasn’t any strength
in the recent top. Add to that the decreasing volume since the start of June
and this looks like a dog.
There
has been a long disconnect between HSI performance and China. For instance:
Dongfeng/600006 was 2.75 a year ago and is now up 6% in 12 months while
Dongfeng/489 was 10.28 and is now up 32% in 12 months. It doesn’t get better
looking at two years where the Mainland listing is -12% and the HK listing is
+5%.
Price
and GURU moving averages:
^HSI(Hang
Seng) has closed above its short term moving average.
Short
term moving average is currently above mid term, and above long term moving
averages.
Mid
term moving average is currently above long term
The
relationship between price and moving averages is: bullish in short term, and
bullish in mid-long term.
Bollinger
Bands:
^HSI(Hang
Seng) has closed below upper band by 48.4%.
Bollinger
Bands are 71.1% narrower than normal.
The
narrow width of the bands suggests low volatility as compared to ^HSI(Hang
Seng)'s normal range. Therefore, the probability of volatility increasing
with a sharp price move has increased for the near-term. The bands have been in
this narrow range for 12 bars. The probability of a significant price move
increases the longer the bands remain in this narrow range.
GURU
Stochastic
K is below D by nearly ~8 points and both are sounding the dive klaxon. Ask
anyone that has sat next to me on a trading floor where I had the dive
klaxon.wav linked to my Bloomberg terminal with real time prices – that is
damned annoying!
GURU
CCI
is neutral at 31
GURU
MACD
Crossovers:
Currently MACD is bearish since it is trading
below its signal line.
MACD crossed below its signal line 3
period(s) ago.
Since MACD crossed its moving average, ^HSI's
price has decreased -0.04%
and has ranged from a high of 23,300.311 to a
low of 23,122.750
Overbought/Oversold:
not in an overbought/oversold range.
Divergence:
there have been no divergence signals within the last 5 periods.
Tech
ratings are 3 to -3 indicating bullish to bearish; a zero is neutral to
cautionary.
This
commentary is not a recommendation to buy or sell. Use at your own risk.
Disclosure:
the firm does not currently hold a position in this stock and has no plans to
create a long or short position over the next 5 business days.


